Asset-based lending is becoming more common for technology firms. Lenders have been closely examining patents as potential collateral, a practice unheard of only a few years ago. A consensus is emerging in academic literature that secured lending with patents as collateral is a form of “credit market innovation”;1 the practice is not a passing fad or a relic of the era when lax standards and credit excesses reigned. Moreover, a recent study found that loans secured by intellectual property (IP) value perform no worse than those secured by tangible assets.2 We explore some recent developments that have facilitated the use of IP assets, especially patents, as collateral.
Introduction
It is clear that more IP assets are now being used in asset-based lending. The number of patents pledged as collateral grew from less than 10,000 in 1995 to nearly 50,000 in 2013.3 Since 1980, 16% of all U.S. patents have been pledged as collateral before their expiration.4 By 2013, 40% of all firms with patents outstanding had pledged their patents as collateral at some point.5 While these data are primarily for loans that include patents packaged with other assets, the trend is clear: intangible assets, particularly patents, are being pledged as collateral for secured financing.
Some recent developments have begun to alter the perception of lenders. Some of these are broad structural trends that are shaping the U.S. economy while others are specific to the asset-based lending market. We explore some of these trends below.
What Has Changed?
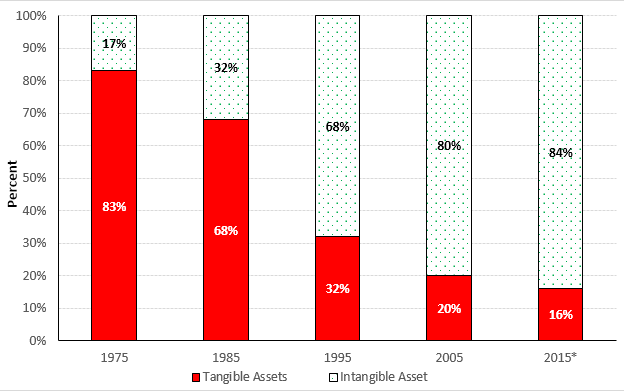
The broadest change is the structural evolution of the U.S. economy. The U.S. has been transitioning from a manufacturing economy to a service economy since the 1970s. More recently, the U.S. is transitioning to a knowledge-based economy where wealth creation stems from technological innovations that give rise to important IP rights. For many technology firms, these IP rights have become their most valuable assets. The rise of companies such as Apple, Google and Facebook reflects the importance of IP in today’s economy. In a knowledge-based economy, physical assets such as property, plant and equipment (PP&E) dwindle in importance relative to IP assets, which provide access to the latest and most innovative forms of technology and act as barriers to entry by competitors. According to IP merchant bank, Ocean Tomo, intangible assets as a percent of market value are at an all time high of 84% for S&P 500 companies.6 The chart below shows the declining proportion of tangible assets from 83% (1975) to 16% (2015).
TANGIBLE VS. INTANGIBLE ASSETS FOR S&P 500 COMPANIES: 1975-20157
This trend is not simply due to the increasing importance of IP assets. There have been parallel developments that have altered the balance sheet composition of technology companies since the mid-1990s. One is the emergence of tolling operators, outsourced builders and contract manufacturers in developing countries. In pharmaceutical and biotechnology industries, contract manufacturing was expected to generate up to $50 billion in annual revenue by 2016 and the market was expected to double by early 2020.8 In the semiconductor industry, the outsourcing of manufacturing to specialized foundries located overseas with lower labor costs have resulted in “fabless” chip companies. This trend allows many companies to shed their physical assets and focus more intensely on research and development (R&D). In addition, the U.S. economy has incurred astonishing productivity gains in recent years by efficiently managing supply chains. The integration of the Internet with e-commerce and back-end processing has enabled many firms to incur less administrative and labor costs. As a result, firms have reduced their inventory and working capital while increasing the utilization of PP&E and finite resources. These trends have had the effect of making the balance sheets of technology firms “lean,” trimming the non-operating and underutilized portion of tangible assets.
Growth of IP Royalties and Licensing Fees
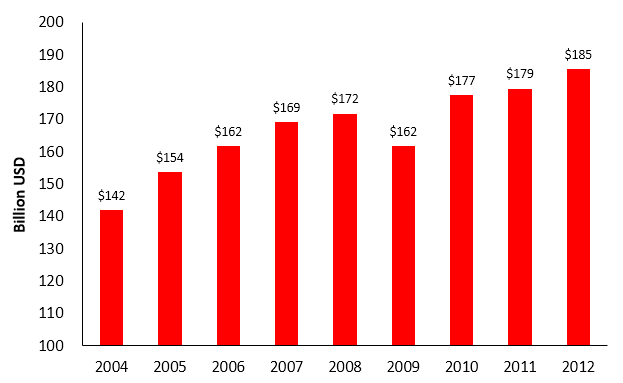 Another important trend has been the increasing revenue generated through royalty income. Since the mid-1990s, income from IP royalties and licensing fees has steadily risen for U.S. companies. Licensing income grew from $60 billion in 1996 to over $154 billion in 2005.9 The compound annual growth rate (CAGR) is about 11% for this period. Except for a dip in 2008 due to the financial crisis, royalty income continued to climb, reaching $185 billion by 2012. The figure below shows the upward trend of royalty income.
GROWTH OF ROYALTY INCOME: 2004-201210
(In Billions of U.S. Dollars)
Most IP assets pledged as collateral generate royalty income from patent or trademark licenses.11 Lenders should welcome revenue-generating patents as collateral, as the loan can be secured by actual income streams. For example, a borrower may offer licensing agreements or royalty streams as either standalone collateral or as
part of an asset package to secure a loan.
Large Market Transactions and Asset Purchases
The growing liquidity of patents is another reason why lenders are now regarding patents as potential collateral. The secondary market for patents largely consists of private transactions or cross-licenses between large technology companies. These sales take place “over-the-counter” and focus on large patent portfolios in bilateral transactions or as part of mergers and acquisitions. In bankruptcies, they involve orderly liquidations of patents that are considered to have salvage value. Google’s purchase of IBM’s 1,023 mobile patents in September 2011 is an example of a bilateral transaction negotiated at arms length between third parties. In recent years, mergers and acquisitions have targeted patent portfolios. For example, in August 2011, Google paid $12.5 billion for Motorola Mobility to access a portfolio of 17,000 patents and 7,500 patent applications. Often, such purchases take place in bankruptcy auctions where bidders organize themselves into consortiums to acquire large portfolios. That was the case for the orderly liquidation of Nortel’s 6,000 patents (June 2011) and Kodak’s 1,100 digital imaging patents (February 2013). Ensuring that the collateral has salvage value is a crucial element in making IP assets eligible for secured lending. The growing number of market transactions have affirmed the view that patents retain salvage value in liquidation. Some of the largest transactions are shown below.
LARGEST MARKET TRANSACTIONS FOR PATENTS12
(Amounts in Millions of U.S. Dollars)
| Date | Buyer | Seller | TechnologySector | Purchase Price | Patent Count | |||
| 2/2013 | Consortium | Kodak | Digital Imaging | $525 | 1,100 | |||
| 11/2012 | Consortium | MIPS Tech | Chip Architecture | 350 | 498 | |||
| 6/2012 | Intel | InterDigital | Wireless | 375 | 1,700 | |||
| 4/2012 | Microsoft | Various | 550 | 650 | ||||
| 4/2012 | Microsoft | AOL | Internet | 1,050 | 1,100 | (1) | ||
| 10/2011 | Sterling | MOSAID Tech | Semiconductors | 594 | 2,822 | (2) | ||
| 8/2011 | Motorola | Wireless | 5,500 | 24,500 | (3) | |||
| 6/2011 | Consortium | Nortel | Wireless | $4,500 | 6,000+ | |||
| Notes: | ||||||||
| (1) | Includes 300 non-exclusive licenses to patents | |||||||
| (2) | Price is for company acquisition, most of which is accounted for by technology. | |||||||
| (3) | Acquisition price for company was $12.5 billion; $5.5 billion estimated for developed technology. Includes 7,500 patent applications. | |||||||
Improved Liquidity Due to Patent Aggregators
In recent years, Intellectual Ventures, RPX, AST and other large patent aggregators have entered the secondary market. These patent aggregators have become an important source of liquidity for original inventors and small firms that do not have the legal and technical expertise to monetize IP assets on their own. Most observers agree that patent aggregators have improved liquidity by providing a clearinghouse for patents.13 This improved liquidity is crucial for asset-based lenders, whose primary concern is the liquidation value of the collateral.
While patents today are more liquid than ever, it is important to put this liquidity in perspective. First, liquidity applies to patents that generate income or have commercial potential. The vast majority of utility patents cover procedures and methods that may be unique but have questionable potential for generating income. Such patents are largely illiquid. If purchased as part of a large portfolio, their value would be determined by their potential role in future litigation. In some cases, the commercial potential of a few patents provides the value for the entire patent portfolio. Therefore, to qualify as collateral, patents either have to generate royalty income or offer high probability of doing so in the near future.
Non-Bank Lenders and the Quest for High Yield
A new trend is emerging where non-bank lenders are offering asset-based loans to technology startups. A growing body of academic literature confirms that hedge funds, investment banks and institutional investors are playing a key role in asset-based lending. Such lenders do not face regulatory constraints of commercial banks and are not beholden to lending standards based on financial ratios and capital regulation. Commercial banks are constrained by higher lending standards which have reduced the credit available to borrowers since the financial crisis. Non-bank lenders, however, have adopted unconventional credit practices and have been willing to lend to technology startups, especially those with marketable patents available as collateral.14 The total amount of assets managed by asset-based lending hedge funds grew from under $1 billion in 2003 to $16 billion in 2008.15
Again, underlying this trend is the structural evolution of the U.S. economy and the balance sheet composition of U.S. companies. As we have shown, the growth of intangible assets and royalty income from IP licenses have led to a changing balance sheet composition for firms in technology industries. The dwindling proportion of collateralizable tangible assets presents an opportunity for non-traditional assets to be considered as collateral. Hedge funds that run asset-based lending funds have always been more willing to consider a broad range of assets, including life insurance, litigation receivables, and intangible assets.16 However, most commercial lenders regard these assets as having a high burden of “asymmetric information;” they are difficult to perform due diligence ex ante and monitor ex post.17
This “opaque” nature of intangible assets has not deterred non-bank lenders. As investors, these lenders have structured loans and crafted covenants to protect the payment of interest and principal. While the loans offered are usually high yield, they may be overcollateralized with a blanket lien on all assets.18 In the event of a default, the liquidation value of the collateralized assets may be more valuable than the operating business. In addition, having an equity conversion feature allows the lender to own the firm in a restructuring. In the opinions of many, non-bank lenders have filled the void in the commercial lending market by offering high-yield loans secured by non-traditional assets like patents.19
Due Diligence and Valuation of IP
The increasing use of patents as collateral may surprise some lenders who still view patents as a non-traditional asset that requires special due diligence. Performing due diligence and appraising patents have long been considered too time consuming and difficult. The first step in due diligence is to check ownership and gauge the likelihood of future ownership challenges. If accepted as collateral, the lender usually takes a “security interest” in the patents, which can be seized and sold in the event of a default. Alternatively, the lender may take ownership of the patents in a sales leaseback transaction; the borrower will retake possession upon repaying the loan. In either case, should the lender end up owning the patents, it has to manage them by monitoring potential infringements, defending them from charges of infringement and administering royalty payments. This includes paying scheduled maintenance fees at the end of years three, seven and 11.20 The time and resources devoted to such tasks could be costly when the patents have not been commercialized and do not generate royalty income.
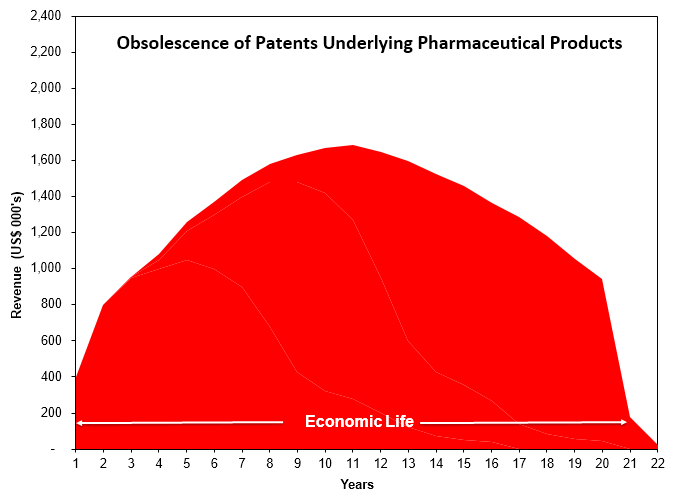
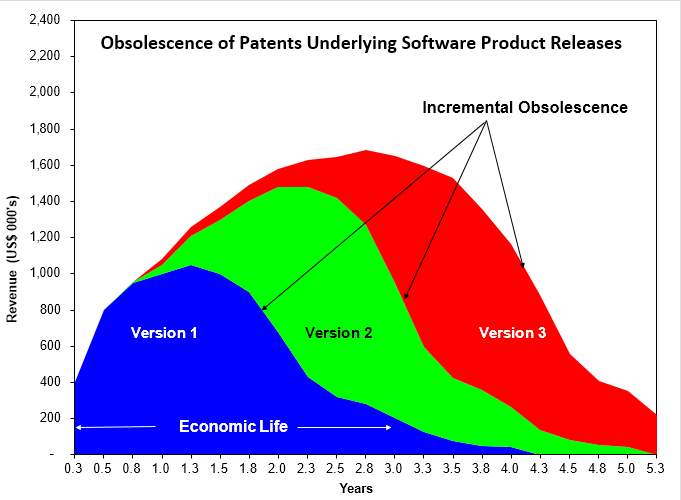
Obsolescence is another issue that arises when performing patent appraisals and IP valuations. Patents are “wasting assets” and are strictly bound by their legal lives, which span 20 years from the date of filing.21 Patents in pharmaceutical and biotech industries lose revenue swiftly and permanently upon expiration. However, patents in other industries may become obsolete a few years after being issued. Patents in software and semiconductor industries, for example, may undergo accelerated obsolescence as new versions of products are released only a few years apart. Depending on the evolution of the underlying technology and the frequency of product releases, the obsolescence of patents proceeds incrementally. The charts below show the economic lives of patents underlying pharmaceutical and software products, which behave in a contrasting manner.
OBSOLESCENCE OF PATENTS: ECONOMIC LIFE
 However, obsolescence may not be as much of an issue for patents that are strictly for defensive or internal use. In fact, many patents contribute only marginally to the technology and the revenue to be generated. Given this lack of parity among patents, their quality and economic value can vary tremendously. Intellectual Ventures is the world’s largest “patent aggregator” which buys patents and aggregates them into a large portfolio to license to third parties and to litigate. By 2012, the company had amassed a portfolio of 35,000 patents.22 According to Intellectual Ventures, as many as 19 in 20 or 49 in 50 patents in its inventory are of such “low value or poor quality”23 that their market value is almost zero. Assessing and valuing patents, therefore, require special expertise and thorough due diligence.
To value IP assets as collateral, one must be experienced in valuing the marketability and commercial potential of patents and patent portfolios. Frequently, this means assessing their values under liquidation and going-concern scenarios. Increasingly, transactions in secondary markets are being factored in as acquisitions in the technology sector are driven primarily by the strengths of IP assets. The value of IP assets can also vary substantially depending on the approach taken and scenarios assumed. In addition to the requisite experience, when valuing IP assets as collateral, it is important to find a third-party expert that is independent of the parties involved in secured lending transactions to ensure the fairness of the valuation.
Sung Kim is senior manager of Appraisal Economics, an independent valuation firm that issues third-party opinions on tangible and intangible assets used as collateral in secured transactions. He
has more than 15 years of experience valuing patents, technology, trademarks and other IP assets. Appraisal Economics values such assets for financial reporting and issues independent solvency and fairness opinions on financing and merger transactions.
Endnotes:
- Loumioti, Maria, The Use of Intangible Assets as Loan Collateral (November 1, 2012), p. 37. Available at SSRN: http://ssrn.com/abstract=1748675 or http://dx.doi.org/10.2139/ssrn.1748675
- Ibid., p. 38. Loan performance was measured as credit rating downgrades, covenant violations, and bankruptcy rates. “[F]irms that pledged their intangibles as loan collateral are 4% less likely to file for bankruptcy over the life of the loan … the results suggest that loans secured by intangibles are of similar quality to other secured loans …”
- Mann, William, Creditor Rights and Innovation: Evidence from Patent Collateral, April 27, 2015, p. 30. Available at SSRN: http://ssrn.com/abstract=2356015 or http://dx.doi.org/10.2139/ssrn.2356015
- Ibid., p. 6. Mann derives the percentage by calculating the portion of patents that are pledged as collateral within 5 years from the year of issue or filing.
- Ibid., p. 1.
- “Annual Study of Intangible Asset Market Value” from Ocean Tomo, LLC, March 4, 2015. The percentage is calculated by subtracting tangible book value from market capitalization. http://www.oceantomo.com/2015/03/04/2015-intangible-asset-market-value-study
- Ibid. The data for 2015 is as of January 1, 2015.
- PharmaLive.com Special Reports, Global Contract Manufacturing Companies: Pharmaceutical and Biotechnology, November 11, 2011.
- SOI Tax Stats Returns of Active Corporations, 1996–2012. Based on Table 5 of Statistics of Income (SOI) Tax Stats. http://www.irs.gov/uac/SOI-Tax-Stats-Table-5-Returns-of-Active-Corporations
- Ibid.
- Alicia G. Mills, “Perfecting Security Interests in IP: Avoiding the Traps,” 128 BANKING L. J. 746 (2008), http://www.dorsey.com/files/Publication/7c9a4920-e4c6-4011-8811-05313de35e9f/ Presentation/ PublicationAttachment/189f4db8-692e-4223-a0e1-33785fd8d0f0/mills.pdf
- Data from various news sources, including 2014 Patent Marketplace Report by RPX Corporation. Available at https://www.rpxcorp.com/wp-content/uploads/2014/12/ RPX_2014_Patent_Marketplace_Report.pdf
- Hagiu, A., D.B. Yoffie. 2013. “The New Patent Intermediaries: Platforms, Defensive Aggregators, and Superaggregators,” J. Econom. Persp., 27(1), p. 60.
- Loumioti, p. 2.
- Shadab, Houman B., “Performance-Sensitive Debt: From Asset-Based Loans to Startup Financing,” 16 University of Pennsylvania Journal of Business Law, 1077 (2014), p. 1136. http://scholarship.law.upenn.edu/jbl/vol16/iss4/3
- Ibid., p. 1137.
- Yael V. Hochberg, Carlos J. Serrano, Rosemarie H. Ziedonis. “Patent Collateral, Investor Commitment, and the Market for Venture Lending.” NBER Working Paper No. 20587. March 24, 2015, p. 8.
- Ibid., p.3.
- Shadab, p. 1140.
- As of August 2015, the fees are $1,600, $3,600, and $7,400 for years 3, 7, and 11, respectively. http://www.uspto.gov/learning-and-resources/fees-and-payment/uspto-fee-schedule#Patent Maintenance Fee
- 35 U.S.C. 154: Contents and Term of Patent; Provisional Rights. For patents filed after June 1995. For earlier patents, the term is 17 years from the issue date or 20 years from the date of filing. http://www.uspto.gov/web/offices/pac/mpep/s2701.html
- Hochberg, et al., p. 11.
- Hagiu, A. et al., p. 60.