
Vice President & Senior Market Analyst,
Thomson Reuters LPC
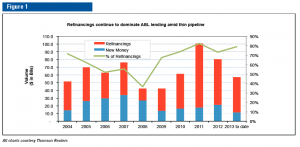
After a slow start to the year, asset-based lenders remain mired in a market burdened by limited deal flow and few signs of any near-term pick up. At just over $57 billion, Q1/13-Q3/13 asset-based lending (ABL) volume is comparable to the same period last year ($59.3 billion). However, Q3/13 represented the lowest quarterly issuance since Q1/10 with just over $13 billion of syndicated lending clearing the market. More significantly, less than $12 billion, or 21%, of ABL lending this year represents new loan assets (Figure 1).
“The quality of activity does not seem to be what it should be,” says one arranger. “I am surprised that volume is that high. It does not feel that it should be.”
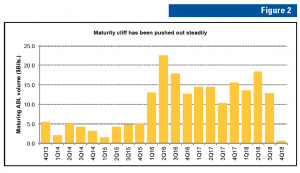
Coming off record high issuance of $101 billion in 2011, in 2012, total syndicated ABL volume marked the second highest total on record at nearly $81 billion. In a trend consistent with that of the broader leveraged loan market, lending during both years was heavily weighted toward refinancings, as issuers sought to push out maturities and reduce spreads on existing credits. In the process, the maturity cliff for asset-based loans was pushed out to 2016-2018 (Figure 2). New money loan creation was limited, however.
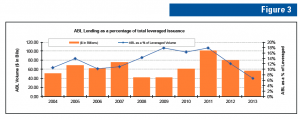
In 2013, leveraged lending continues to struggle with substantial deal churn in the absence of a reliable or steady pipeline of new deal creation. At the end of September, cash-flow and asset-based leveraged lending hit record levels at almost $848 billion, but only 31% of the total represented new money lending. Amid the large number of recycled leveraged credits and an uneven calendar of new money financings, ABL represented a thin 7% of total leveraged lending — the lowest pro rata share on record. (Figure 3).
Year to date issuance levels — while not setting records — are nonetheless on pace to close out 2013 totals well north of $60 billion. This is on par with historical totals, but the threshold gives lenders little comfort.
“If we had $80 billion, people would be happy,” says one lender. “If it was $60 billion but new money was higher, that would be better.”
“The pipeline is not that big in Q4,” adds another arranger. “And given the volume of refinancings in the last two or three years, with so little M&A, at some point things have to slow down.”
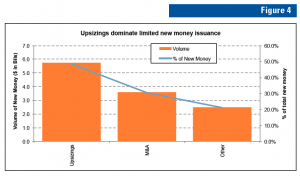
So far this year, M&A financings represent about 7% of total ABL issuance — the lowest level since 2010 (Figure 4). Corporate M&A did see a pickup in Q3/13 — including a $1 billion credit backing the all-stock merger of Spartan Stores and Nash Finch — but such deals were few and far between. More significantly, the new, thinly priced Spartan Stores financing replaces a pre-existing ABL credit.
“A corporate to corporate deal is not a highly leveraged transaction,” said one lender. “What you are not seeing is transformative, high-risk transactions,” the lender added, which can leverage the ABL structure for deeper borrowing needs.
Off low benchmarks, M&A lending represented just more than 30%, or $3.6 billion, of completed new money ABL volume in the first nine months of the year. Sponsor-to-sponsor buyouts did tick up in late Q3/13 via a series of deals for issuers including Dell, Saks and Neiman Marcus. Most of these deals have a Q4/13 closing date and will support full year totals, but lenders note that even if M&A discussions are picking up, retail investment opportunities will remain limited.
“We have seen an increase in M&A volume,” one lender said. “But most of it is single lender stuff — $20 million-$40 million deals.”
As a result, several larger, ABL teams said they have improved their connectivity with the middle-market groups at their shops as well as with investors who are willing to partner up a sole lender private term loan with a sole lender ABL credit in order to get an M&A deal done.
At the same time, a number of shops point out that they are selectively exploring lending opportunities in industries — including the technology and healthcare sectors — which have not traditionally fallen within the scope of ABL.
Amneal Pharmaceuticals tapped the market at the end of September with a $565 million dividend recap deal that included a $90 million asset-based tranche. The ABL component rounded out liquidity via a $475 million covenant-lite TLB for the healthcare name.
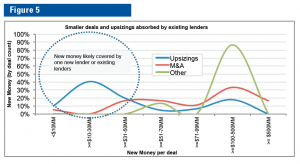
At nearly $6 billion, almost 50% of total new ABL volume came in the form of upsizings on existing credits. More than 70% of upsized credits represented step-ups of $50 million or less — incremental commitments that can arguably be absorbed by one new lender or even existing bank groups (Figure 5).
“The market is difficult if you are an investor,” said one arranger. “Deals less than $300 million-$500 million are spoken for, so there is not a lot of retail syndication.” No one expects this to change in the near term.
Unsurprisingly, the competition for assets has put pressure on yields. Average drawn spreads for syndicated ABL credits of at least $75 million stood at roughly LIB+204, down from year ago levels of just over LIB+227. Upfront fees have likewise been miniscule, according to lenders.
“The economics are getting worse,” said one arranger. “What you have not really had is a test on spreads. Where do you price a middle-of-the-fairway, current asset-driven deal?”
In the absence of viable benchmarks on new credits, in Q3/13 the majority of deals that came to market had pricing concentrated in spread baskets ranging between 150bp-200bp, down from between 175bp-225bp at the start of the year (Figure 6).
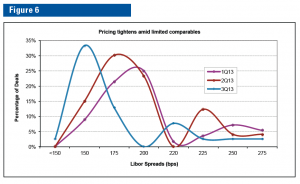
Lenders said that for smaller, clubbier credits, pricing has inched down even further to 125bp-175bp. The question then becomes whether this tightening may filter up to the more broadly syndicated loan market.
Maria C. Dikeos is a vice president and senior market analyst at Thompson Reuters LPC in New York and has been with the company since 2001. Her focus is primary market analytics including the production of league tables and industry analysis, as well as the enhancement of data collection and expansion of product offerings. Previously, she worked as an associate at a major investment bank.